
Friday, March 2, 2018
Thursday, March 1, 2018


Thursday, February 15, 2018

Monday, February 12, 2018

Sunday, February 4, 2018
NDX repeating a pattern
Friday saw a sudden drop in NDX 100 index, considered as a worse week of the past two years. Interestingly it happened right after one of the best months of the past two years. I do believe that it was just another profit taking episode and nothing else. After a sharp run up that we saw in the last month, some profit-taking by nervous short-term stock holders was all but natural. The whole process, however, may be somewhat more complicated. A sell off like this is usually is the product of several participants with different mindset, account size and profit goals. Usually a long and sustained run-up develops within its participants a mindset of never ending bull market, where these players keeps on buying a market that is dully rewarding them and enticing them to keep increasing the bet size. After a while and some considerable gains a mindset of 'giving it all back' sets in and a slight decline on any given day turns that mind set into a fear, what makes it worse is the triggering of stop loss orders, traders watching their fortunes turning from big gains into losses start selling their long positions in a panic. Adding to euphoria is the short sellers doubling down on their positions from days or weeks prior, who were closely watching an extended markets and anticipating a sell off to happen soon. The result is a sharp and abrupt declines just like the one we witnessed last Friday that evaporates several weeks of gains within hours.


Monday, January 29, 2018

Thursday, January 18, 2018
5 cryptocurrencies to watch
These are the virtual currencies that did better than bitcoin
Ripple
The bestseller among the top five of the largest cryptocurrencies. Ripple went from a fraction of a penny ($0.006523) to $2.29, ending the year with an astonishing growth of 35,000 percent, up 350 times in value. With its market cap north of $100 billion, ripple passed the competition to become the world's second most valuable cryptocurrency after bitcoin.
Ripple is more known for its digital payment protocol than its cryptocurrency. In other words, ripple is a cryptocurrency that acts as a bridge currency to other currencies and doesn’t discriminate the peers whether they are using digital money or fiat currencies.
Growth in 2017: $0.006523 to $2.29, up 35,000 percent
Ethereum
Launched by a Russian-Canadian IT programmer Vitalik Buterin, ethereum is the third-largest cryptocurrency with a market capitalization exceeding $80 billion. Worth just $8 at the beginning of last year, ethereum has grown almost 100-fold by the end of 2017.
The ethereum blockchain has become the most common platform for initial coin offerings (ICOs). From a user’s point of view, bitcoin is just a payment system.
2017 growth: $8 to $750, up 9,500 percent
Bitcoin cash
The original bitcoin has spun off bitcoin cash, bitcoin gold, and many other bitcoin-branded cryptocurrencies. Not all of them are successful, but this one definitely is.
Having split from bitcoin in August, bitcoin cash has seen an increase in the size of blocks from bitcoin’s one megabyte to eight. Bitcoin cash is faster than mainline bitcoin and boasts smaller commission fees.
However, it is often criticized for being overly centralized. Most of bitcoin cash mining is done out of Korea, and most of tokens are owned by just two people, Jihan Wu and Roger Ver.
Having split from bitcoin in August, bitcoin cash has seen an increase in the size of blocks from bitcoin’s one megabyte to eight. Bitcoin cash is faster than mainline bitcoin and boasts smaller commission fees.
However, it is often criticized for being overly centralized. Most of bitcoin cash mining is done out of Korea, and most of tokens are owned by just two people, Jihan Wu and Roger Ver.
2017 growth from $555 to $2,550, up 500 percent since August
Cardano
This digital token is essentially a blockchain that works both as a cryptocurrency and a smart contract platform. Its goal was to become the “first blockchain project to be developed from a scientific philosophy.”
The mysterious cardano cryptocurrency has enjoyed massive growth in the three months since it was launched on October 1.
Growth in 2017: from $0.02 to $0.70, up 35 times in value since October
Litecoin
Launched in 2011 with the goal of being the 'silver' to bitcoin's 'gold' by Charlie Lee, an MIT graduate, and former Google engineer. Just like bitcoin, litecoin is generated by mining.
It was developed to improve on bitcoin's shortcomings and has earned the market support along with high trade volume and liquidity over the years. Litecoin is designed to produce a maximum of 84 million coins, four times that of bitcoin.
Some experts say litecoin should be worth exactly one-quarter of bitcoin. Now it is only worth two percent of the world’s most valuable cryptocurrency.
Lee has sold all his tokens saying he no longer needs to “tie his financial success to litecoin’s success.” At the time of the sale in December, Lee reportedly enjoyed a 7,500 profit on his cryptocurrency.
Growth in 2017: from $4.33 to $233, up 5,500 percent
Tuesday, January 2, 2018
NDX 2018 breaking out 1st day of 2018
Today 1st trading session of 2018 NDX broke of the losing streak since it made a new high of $6535on 12/18/2017. If the pattern repeats we should see $6600+ from today's breakout.


Wednesday, December 27, 2017

Thursday, October 5, 2017
Another breakout from NDX
Just something to keep in mind that breakouts are also sometimes reversal points.. Fresh new ATH going into the bullish period of the year.


Tuesday, October 3, 2017
FRIDAY, OCT 06 - Economic data
12:30 USD Nonfarm Payrolls (Sep)
generally speaking, a high reading is seen as positive (or bullish) for the USD, while a low reading is seen as negative (or bearish),
12:30 USD Unemployment Rate (Sep):
a decrease of the figure is seen as positive (or bullish) for the USD, while an increase is seen as negative (or bearish),
Tuesday, August 29, 2017
Gross Domestic Product Annualized (Q2) - Aug 30th
Get more information about:
The Gross Domestic Product Annualized released by the US Bureau of Economic Analysis shows the monetary value of all the goods, services and structures produced within a country in a given period of time. GDP Annualized is a gross measure of market activity because it indicates the pace at which a country's economy is growing or decreasing. Generally speaking, a high reading or a better than expected number is seen as positive for the USD, while a low reading is negative.
| |||||||||||
Monday, August 14, 2017
Bitcoin (GBTC) from $74 to $760 in one year
Bitcoin ($gbtc ) has moved from the $70's to $700's within the year!


Thursday, August 3, 2017
NDX recent behavior
The start of Aug we seeing a lot more red-to-green and green-to-red reversals.
07/27/17 07/31/17 08/02/17

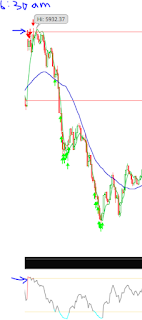


07/27/17 07/31/17 08/02/17


Monday, July 24, 2017
GOOG, AMZN, FB Earnings this week
More than a third of the S&P 500 companies and 13 Dow stocks reporting this week.
Monday
Earnings: Alphabet, Anadarko Petroleum, Celanese, Halliburton, Illinois Tool Works, Luxottica, Stanley Black and Decker, Ryanair, Arconic, Manpower Group, VF Corp
Tuesday
FOMC meeting begins
Earnings: 3M, Caterpillar, McDonald's, United Technologies, General Motors, Eli Lilly, Biogen, Amgen, AT&T, Chipotle, U.S. Steel, Express Scripts, Kimberly-Clark, Freeport-McMoran, Seagate Technology, JetBlue, TransUnion, T. Rowe Price, Akamai, Texas Instruments
Wednesday
Earnings: Facebook, Boeing, Coca-Cola, Gilead Sciences, PayPal, Samsung, Discover Financial, Northrop Grumman, Nasdaq OMX, Hershey, Corning, DR Horton, Daimler, Ford, LVMH, Anthem, General Dynamics, Norfolk Southern, State Street, Six Flags, F5Networks, Vertex Pharma, Whole Foods
Fed Meeting
Thursday
Earnings: Amazon, Intel, Starbucks, MasterCard, Bristol-Myers Squibb, Celgene, Fiat Chrysler, Verizon, Comcast, Twitter, Altria, A-B InBev, AstraZeneca, Royal Dutch Shell, UPS, Total, Raytheon, Dr. Pepper Snapple, Southwest Air, Dunkin Brands, Deutsche Bank, Diageo, Nokia, Mattel, Boston Beer, Expedia, Brunswick, Baidu
Friday
Earnings: Exxon Mobil, Chevron, Merck, American Airlines, AbbVie, Barclays, UBS, Baker Hughes, BT Group, Cabot Oil and Gas, BNP Paribas, TransCanada, Credit Suisse, Weyerhaeuser, Nomura, CMS Energy
Wednesday, July 19, 2017
Economic Reports for July 20th - Employment data
Tomorrow's employment data could move the markets. Something to be aware of.


Tuesday, July 18, 2017
NDX ATH's again ??
The up-move that started in NDX on 7/7 has been strong, taking us back to the ATH's today. Although the uptrend is very strong the market could very well go sideways from here for a few weeks before determining the next direction.
The 30min time frame the index has moved up considerably since its breakout on 7/7.

The daily time-frame shows the index's almost parabolic move and seems a bit over stretched above the 50 DMA.

The 30min time frame the index has moved up considerably since its breakout on 7/7.

The daily time-frame shows the index's almost parabolic move and seems a bit over stretched above the 50 DMA.

Friday, July 7, 2017
NDX 30m vs Daily chart
30 Min: chart shows a range bound movement between 5670 and 5570. Today we closed at the top of that range. Monday will be interesting to see weather we breakout of that range or move down to the bottom of the range.

Daily: Today's big green bar above the 50 DMA is bullish and could be signaling a reversal of the down trend in NDX.

Wednesday, July 5, 2017
NDX another leg high or lower??
30 Min Chart shows could be another leg Lower:

Daily Chart shows could be another leg higher:

Subscribe to:
Posts (Atom)