Tuesday, December 29, 2015

move above 207 again

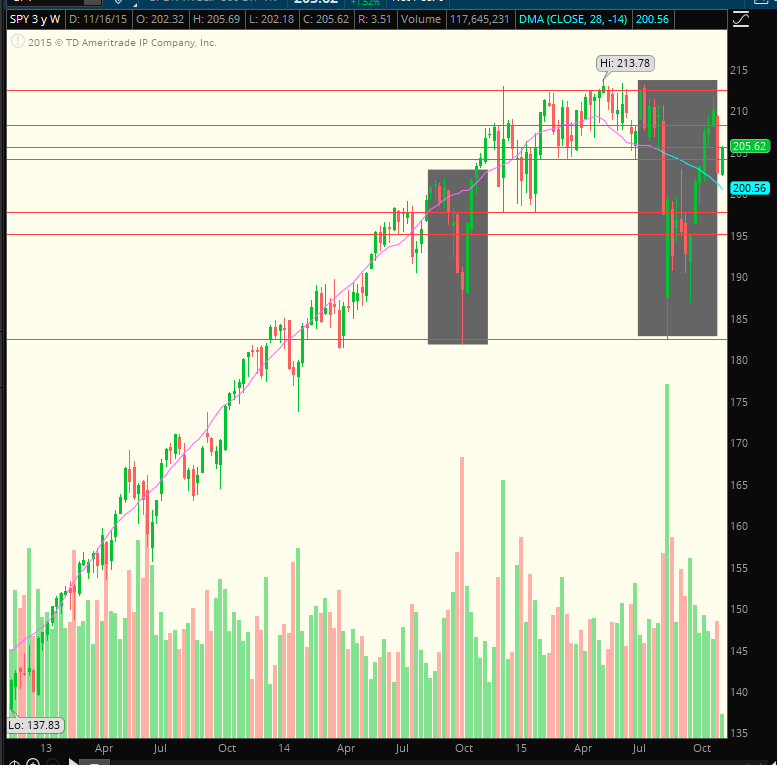
this where we have seen selling before but this is a very bullish time of the year...


Wednesday, December 23, 2015

moving above 207 again?

207 is where things change, and we see selling..


Tuesday, December 22, 2015

lower lows and lower highs

The straight decline from last week finally stopped at 200 level but what we can see from the chart is that we are consistently seeing lower lows and lower highs. Consistent with the data as the economy is slowing down:

The Existing Home Sales, released by the National Association of Realtors, provide an estimated value of housing market conditions. As the housing market is considered as a sensitive factor to the US economy, it generates some volatility for the USD. Generally speaking, a high reading is positive for the Dollar, while a low reading is negative.


10.5%
Actual
0.0% 
Consensus
-4.1%
Previous Revised from -3.4%


Wednesday, December 16, 2015

We might see 210 again

The Fed has increased the rates as promised and the market rallied today even though high interest rates means higher yields on bonds and investors should start buying bonds and equities prices should decline but that premise did not hold true today. As the Fed chairman said the rate increase is a testament that the economy is healthy and can sustain the rate hike now. This is the most bullish time of the year for the market any ways so the rate increase may have nothing to do with the rallying market as we can see the SPY has bounced at two other occasions from the same levels before so here we go 210 and may be beyond.


Fed Interest Rate Decision Dec 16


Dec 16
19:00
0.375% 
Consensus
0.250%
Previous

The Board of Governors of the Federal Reserve announces an interest rate. 
This interest rate affects the whole range of interest rates set by commercial banks, 
building societies and other institutions for their own savers and borrowers. 
It also tends to affect the exchange rate. Generally speaking, if the Fed
is hawkish about the inflationary outlook of the economy and rises the interest 
rates it is positive, or bullish, for the USD
.

Tuesday, December 15, 2015

support held

Looks like SPY found support around the 202 area.. still need to see what happens with the Fed's data comes out..


Monday, December 14, 2015

support holding?

Earlier in the day it appeared as if there was no support. Price went straight through the support line but just before the close the price rebounded bouncing above the support line. It will be interesting to see it we rally from here for the rest of the year. Here is what I read this morning Tim Knight's projections http://slopeofhope.com/2015/12/my-dream-w-a-g.html


Friday, December 11, 2015

SPY near the Nov lows (and Sept highs)

A straight decline for a week for SPY and now near the Nov lows (and Sept highs). It will be interesting to see if we can rebound from here on Monday as we have seen it previously on two occasions. After making a high of 211 last Wed (12/2) the market has declined for more then a week. Although we are waiting for a rate hike in the US, which is supposedly bullish for stocks, this decline could be attributed to the decline in crude/commodities prices and the Environmental meeting being held in France. Technically we are at a point where we could see a bounce from here but nothing is for sure in the stock market.


Wednesday, December 9, 2015

Still above the trend line

Despite the three day decline in a row, SPY still staying above the trend line.. I believe until the Fed decides on the interest rate the market is going to be volatile.


Tuesday, December 8, 2015

Support 205.5 Resistance 210

I think if we keep falling down the first support area along the trend line could be 205.5, while there seems to be plenty of sellers above 209-210 area.


Thursday, December 3, 2015

Do we see a bounce tomorrow?

We have bounced from the trend line in Nov. can it happen again?
Tomorrow's job report is a key data for the fed to decide on raising the interest rate in its next meeting. I think the mrkt can rebound if the jobs report is according to expectations.


Wednesday, December 2, 2015

The fed is supposed to raise interest rate by .25% this month


The Fed is supposed to raise the interest rates by 0.25% the middle to Dec. but it will depend on the other economic indicators like employment and inflation data.

Thursday's important Economic events:

ECB Monetary policy statement and press conference
Following the ECB´s economic policy decision, the ECB President gives a press conference regarding monetary policy. His comments may influence the volatility of EUR and determine a short-term positive or negative trend. His hawkish view is considered as positive, or bullish for the EUR, whereas his dovish view is considered as negative, or bearish.


Fed's Yellen testifies
FED’s chair testifies before the Congress or some of its Committees to explain the current economic situation and the policies applied to improve it. After the testimony, a Q&A session follows, which can imprint strong volatility across the board

Friday's important Economic events:

Unemployment Rate (Nov)
The Unemployment Rate released by the US Department of Labor is the number of unemployed workers divided by the total civilian labor force. If the rate is up, it indicates a lack of expansion within the US economy. Therefore, a decrease of the figure is seen as positive (or bullish) for the USD, while an increase is seen as negative (or bearish).

Nonfarm Payrolls (Nov)
The non-farm payrolls released by the US Department of Labor presents the number of people on the payrolls of all non-agricultural businesses. The monthly changes in payrolls can be excessively volatile. Generally speaking, a high reading is seen as positive (or bullish) for the USD, while a low reading is seen as negative (or bearish).

Tuesday, December 1, 2015

a clear breakout?


1st day of the month and there seems to be a clear breakout from the previous range and consolidation below 209. As soon as the previous high of 210.3 was taken out we moved to new high's. The next target/resistance should be around the 211.6 area.


Monday, November 23, 2015

209 Level is important

Last Thursday (11/19) we consolidated under 209 staying under it all day, gaped up the next morning
moved above 210 twice, moved below 209 twice and then moved back to it each time. Something tells me that if we moved above 209 the third time we will continue the up move until 212.


Thursday, November 19, 2015

209 offers strong resistance for SPY


209 acted like a brick wall today for SPY, consolidating under that level all day. It will be interesting to see if we repeat yesterday's actions tomorrow (overcoming the 209 resistance area and moving towards the 210.2 level). Failing to overcome this resistance we will definitely see pull back to the 207 support area.


Wednesday, November 18, 2015

FOMC minutes coming out tomorrow


So we are back to 208 level. We were here just a week ago, on Wednesday Nov 8th the market took a dive. Found support around 202 level, bounced back off of that level on Monday. The turn around made it to the 207 level which acted as a resistance, we pulled back to the 205 level on Tuesday. The 205 level has been acting as a strong support recently. On Wednesday the market gaped up, consolidated around 207 for a few hrs and made a deceive move up towards 208 level. Taking it back above the 21 day SMA and hitting the 208 level after a week. The next resistance (according to my chart below) is at 209 level. It will be interesting to see what happens tomorrow as we have the FOMC minutes coming out tomorrow as well.


Monday, November 16, 2015

SPY bounced off near 50 Day EMA

Will see if there is follow through next few days. The 8 day and 21 Days SMA's are crossing too.


Friday, November 13, 2015

SPY support and resistance


All these prices are important points for SPY:

MA(50):   200.6
MA(200): 205.01

Support:

208, 207.24, 206.4, 204.4, 202.4, 201.6, 200, 199.50, 198, 197, 196.01, 194.35, 191.7, 190.50, 188, 183, 182.4, 181.92, 173.71.

Resistance:

210.25, 211, 212.24, 212.59, 213.35, 213.78


Thursday, November 12, 2015

Support around 204 area

Can it find buyers around the 204 area, it has acted as support on 5 different times previously, if 204 does not act as support then the next strong support is 200 area. SPY sinked below all the major SMA's (8 SMA 209, 21 SMA 207, 200 SMA 206.5). Similar situation as the last week of Sept. could see another drop if the 204 support does not hold tomorrow's session could be crucial.


Monday, November 9, 2015

SPY breaks below 8 SMA

SPY managed to stay above its 8 DMA since 02 Oct when it move above it after the august lows. Today it has moved below it's 8 DMA. Next stop could be 21 DMA 206?


Friday, November 6, 2015

SPY moving along the bullish trend line


Another move up next week? that is what it looks like from the chart below,


Thursday, November 5, 2015

Tomorrow's job report could make the mkt move


Just moving along the trend line... just touch the trend line (also happens to be a 8 SMA 209.2) and keep on moving higher? If there is a pullback 200 SMA is 206.3, gap fill around 205, 21 SMA is 205.3.


Tuesday, November 3, 2015

SPY Nov,14 vs Now


The two rectangle areas are very identical, around the same time of the year, except in Nov, 2014 the 200 MA was sloping up vs now (Nov 2015) its still sloping downward, will be interesting to see if the DMA move up or price comes down to meet it?


Monday, November 2, 2015

Thursday, October 29, 2015

Wednesday, October 28, 2015

Another breakout

SPY trading above 208... the FOMC meeting minutes are happen to come out today


Tuesday, October 27, 2015

FOMC meeting on 10-28-15

There is an FOMC announcement due out tomorrow at 2 pm... the market is most likely going to move after the event. It will be interesting to see in what direction it moves, after the last two events the market moved higher. Both today and yesterday the SPY has been stalling,undecided, it will likely make a decisive move after the meeting minutes are out.

SPY is holding its 200 DMA so far today.  AAPL earnings after close today.


Monday, October 26, 2015

SPY Stalling??

A new top or just 'buy the dip' oppertunity?


Thursday, October 22, 2015

a reversal from support of 202

Move above 205.5... 206 is 100 DMA


After Hours: 206.58 +1.32 (0.64%)


SPY 206 important level on the daily chart


Wednesday, October 21, 2015

SPY 202 was the support that broke


Tracking SPY, some charts:


Thursday, October 15, 2015

SPY at a new two month high


SPY today 10/15/15


Wednesday, July 8, 2015

SPY new range

SPY - 30 min: 

back into the range, 198/196/193.40 support, resistance 199.5/200/201.75


Tuesday, June 23, 2015

spy at resistance


$212.5 - $213 all time high or resistance?


Saturday, June 20, 2015

Monday, June 15, 2015

Friday, June 5, 2015

Tuesday, May 26, 2015

spy-trade BB RSI


spy trade

Bollinger Bands opening- volatility spike, RSI at a low


Saturday, May 23, 2015

Consideration for trading weekly options


As weeklys options are more cost effective way to trade around short-term, premiums are a fraction of the cost of monthly options. You can purchase more contracts for the same total investment when compared to monthly.

I consider the following for my weekly options trades:

  1. An option strike with a delta of .65 or higher, meaning you make $.65 or more for every dollar move of the underlying. Higher deltas have higher premiums.
  2. The spread between the bid price and the ask price on an option. I don't enter an option where the spread between the bid and ask is more than $.10. If the spread is too wide when you purchase an option contract you are down the amount of the spread. 
  3. The strike should have some volume and must have open interest of at least 100. I don't buy more than 1 0% of the open contracts. I check the historical information on the option. 
  4. Buy the appropriate time frame option for the strategy, I am trading the options with no intent to purchase the underlying equity. I close the trade if it has premium > $.10 so it is not exercised. If it has no value at expiration, there is no need to close.
  5. Purchase weekly option that should fit my trade account and risk. It is tempting to go cheap by buying way out-of-the-money strike price options. I buy strikes that (are in-the-money call or puts) fit my available funds. Each strategy has specific requirements. 

**Out-of-the-money (OTM) options are comprised entirely of time value or extrinsic value, while a      deeply in-themoney (ITM) option is comprised almost entirely of intrinsic value.


Wednesday, May 20, 2015

spy trade

SPY chart with some indicators:


Friday, May 15, 2015

SPY Bollinger Bands RSI


Bolinger-bands are at the most contracted phase.. could lead to expansion next week.

Tuesday, April 28, 2015

SPY-trade

http://tos.mx/O0yDlI

SPY 30 min Chart


Tuesday, April 7, 2015

The updated 1Q Volatility Kings™ master list.
table

Tuesday, March 24, 2015

Economic Calendar


Economic Calendar</!--a> >> Add to your site