Wednesday, December 28, 2016

Initial Jobless claims: released tomorrow morning

Initial Jobless Claims:

Released by the US Department of Labor is a measure of the number of people filing first-time claims for state unemployment insurance.

It provides a measure of strength in the labor market.

A larger than expected number indicates weakness in this market which influences the strength and direction of the US economy.

A decreasing number should be taken as positive or bullish.
Monday, December 19, 2016

NDX has established a new range

NDX has established a new range but the bars are lot wider then I have seen before, meaning the market has a wider daily range...


Tuesday, December 13, 2016

NDX breaking out today

NDX break out of the trading range that it has been in since Aug of this year. We have not seen prices this high for a long time. It is that time of the year where the markets rally but we also have a historic event happening, the Fed's decision to hike the interest rate, something it has not done in a decade. Normally indices will be very volatile or moving sideways waiting the Fed decision. Today seeing the how the markets rallied ahead of the decision tells me that either the most traders are certain of the outcome of the meeting or it does not matter what happens at the meeting. I wonder if the Fed does not raise the rates as is widely expected, the markets could dive nose down? Something interesting to watch.


Wednesday, December 7, 2016

Jobless claims report tomorrow morning

This jobless claims being the significant read on the jobs market before the Fed decision next Wednesday. If jobless claims repeats what it showed last week, a jump in claims, it will that the markets have a problem of increased joblessness. Signaling a weakening state of the economy the Fed will likely not pass on a rate hike. Today's market rally was a brisk one all the indices were up DJI gained 300 points and NDX which has been in a  downward trend gained 63 points but something interesting to observe is VIX also gained .43 not a significant number but unusual on a day like today!
NDX still trading in the box.


Monday, November 14, 2016

New president Donald Trump??

Taking the Presidency, the House of Representatives, the Senate, and the Supreme Court republican party is in full control at the helm. What that means for the economy and the stock market? The policies that were highlighted during Trump's campaign focused on building the infrastructure, 'The first fiscal stimulus in eight years will pour $1 trillion into infrastructure spending' according to an article on seekingalpha.com. 

Major losers from Republicans policies could be technology, foreign/global equity sectors:

Alphabet (NASDAQ:GOOG) - Technology
Apple (NASDAQ:AAPL) - Technology
Facebook (NASDAQ:FB) -Technology 
Amazon (NASDAQ:AMZN) - Technology 
Tesla (NASDAQ:TSLA) - Electric Cars
First Solar (NASDAQ:FSLR) - Solar Panels
Sun Power (NASDAQ:SPWR) - Solar Panels
General Motors (NYSE:GM) - Globalization
AT&T (NYSE:T) - Telecommunications
Mexico (NYSEARCA:EWW) - Mexico ETF
China (NYSEARCA:FXI) - China ETF
Euro (NYSEARCA:FXE) - Euro ETF
Yen (NYSEARCA:FXY) - Yen ETF
Gold (NYSEARCA:GLD) - Gold
Major beneficiaries of the Republicans policies could be infrastructure, oil & gas, financials, defense and Big pharma 
Caterpillar (NYSE:CAT) - Infrastructure
US Steel (NYSE:X) - Infrastructure
Nucor (NYSE:NUE) - Steel
Pfizer (NYSE:PFE) - Big Pharma
Ely Lily (NYSE:LLY) - Big Pharma
Lockheed Martin (NYSE:LMT) - Defense
Freeport-McMoRan (NYSE:FCX) - Commodities
Exxon Mobil (NYSE:XOM) - Big Oil
Occidental Petroleum (NYSE:OXY) - Energy
Bank of America (NYSE:BAC) - Financials
Goldman Sachs (NYSE:GS) - Financials
Lennar Homes (NYSE:LEN) - Homebuilding

Thursday, October 27, 2016

GOOGL, AMZN, LNKD, BIDU

Big earnings announcements today from GOOG, AMZN, LNKD, BIDU and others. NDX is trading in a narrow range maybe till the election results are out.


Monday, September 26, 2016

NDX is trading in the range again

After making new highs for the year last week, NDX is back in the range ($4836- $4750) that it has been trading since the start of Aug end of July this year. At the moment it looks as if the 50DMA ($4800) is proving to be the resistance/floor for the index. But for it to stay in the range, the bottom of this range is around $4750 so we will have to wait and see if that holds in case we break below the 50DMA.


Friday, September 9, 2016

NDX breaking of the range today

Finally after a month of trading in a range bound, NDX broke out this morning. Now the clear downward trend has initiated. A move below the 50 DMA for the 1st time since the 1st week of July. As we are witnessing today and from what can be seen below is the 200 DMA,, when does it gets to that point is anybody's guess, I am not predicting anything here. Additionally something to keep in mind is the 50 DMA is still upwards slopping. For a larger move to happen, we will have to see it slope downward crossing below the 200 DMA and we can see even a larger move to the down side. Typically the longer the market stays in a consolidation phase the sharper the breakout that follows.


Thursday, September 8, 2016

NDX moving in a tight range

Since the beginning of August, NDX is range bound 483*-475*.


Friday, August 26, 2016

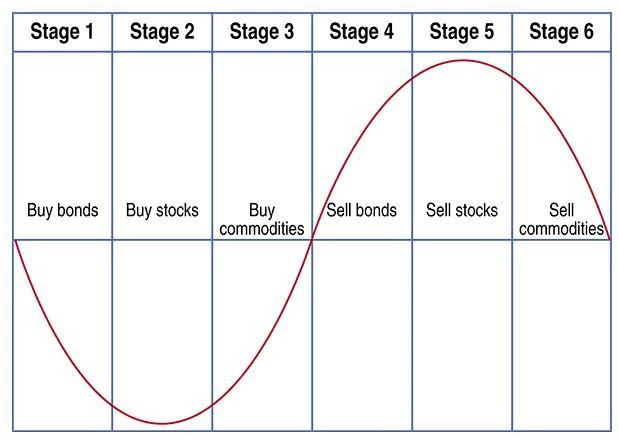
Inter-market Relationships


Relationships between:

- stocks and bonds 
- bonds and commodities 
- commodities and the dollar.

in an inflationary environment include:

  • A positive correlation between stocks and bonds (with bonds usually leading).
  • A negative correlation between bonds and commodities.
  • A negative correlation between the US dollar and commodities.

In a deflationary environment: 
  • A negative correlation between bonds and stocks.
  • A negative correlation between commodities and bonds.
  • A positive correlation between stocks and commodities.
  • A negative correlation between the US Dollar and commodities.


Thursday, August 18, 2016

NDX in tight consolidation

With Aug. 15 looking like a breakout the next day was a complete reversal and the index has still remained under a resistance level 4812 area. This is summer trading with volume being low consolidation is likely to continue. It will be interesting to see if the market continue to see new highs for the reset of the year or we see a big dip (a 10% correction) as everyone is anticipating this year. The economy is doing well as shown with the earning estimates beating expectations. Another reason for the markets move higher this summer was the upward trajectory in oil and gas prices.


Thursday, August 4, 2016

Relationship Between the FED and Repo


NFP Day Tomorrow (Friday Aug 5th)

The market has been trading in a close range waiting for the two important economic news to come out.


Aug 05
12:30
287K 
Consensus
180K
Previous

Unemployment Rate (Jul):


Aug 05
12:30
4.8% 
Consensus
4.9%
Previou

Wednesday, July 27, 2016

AMZN & GOOG reports after close tomorrow (Thursday)

As expected the fed kept rates unchanged. Markets breakout to the upside..

ACTG, AFL, AIV, AJG, ALDW, ALGN, ALJ, AMZN, ARII, ATEN, ATR, AUY, BCOV, BGS, BIDU, BOOM, BRKS, CAA, CATM, CBL, CBS, CENX, CHMT, CLD, CLMS, COLM, COWN, CPHD, CPT, CUBE, CWST, CY, DECK, DGI, DGII, DLR, DTLK, ECOL, EEP, EGO, EHTH, EIX, ELLI, EMN, EQC, ES, ESS, EXPE, EYES, FE, FET, FICO, FII, FIX, FLS, FPO, FR, FTNT, GIMO, GNMK, GOOG, HIG, HLS, IM, INVA, INVN, ISIL, ITGR, IXYS, KAMN, KBR, KLAC, KRG, LEG, LMNX, LPLA, LYV, MATW, MOBL, MSCC, MSTR, MTD, N, NGVC, NR, NSR, OMCL, OUTR, PCCC, PDFS, PFG, PXLW, QGEN, QSII, RGA, RMD, ROVI, RSG, RTEC, SB, SBAC, SKYW, SNMX, SPNC, SRCL, STMP, STRZA, SYNA, TCO, TFSL, THG, TLGT, TNDM, UCTT, ULH, VCRA, VDSI, VRSN, WDC, WLK, WRI, WYNN, YRCW


Monday, July 25, 2016

AAPL declare earnings tomorrow (Tuesday) after close

Earnings after close tomorrow:

AAPL, AIZ, AKAM, AKR, ALDR, AMP, APC, ARI, ASH, AXS, BCR, BJRI, BLDP, BVN, BWLD, BXMT, BXP, CAVM, CB, CEB, CHRW, CINF, CNO, CSV, CTXS, CUZ, CVA, DDR, DMRC, DOX, EQR, ETH, EW, FSP, FTK, GHL, GLF, GMED, HUBG, HURN, ILMN, IRBT, JBT, JNPR, KN, LLTC, LNDC, MDR, MTCH, MTSI, NANO, NCR, NUVA, OIS, PEI, PNRA, PSB, QTS, RGC, RHI, RNR, RRC, RSYS, SGEN, SKT, TGB, TRMK, TRU, TSS, TWTR, UDR, UHS, UIS, ULTI, UMBF, USNA, VR, WES, WGP, WNC, X, ZION, ZIXI


Monday, July 18, 2016

Don Miller- The Weekend Trader - 6-18-16 Stop Being Timid!

NFLX reports earnings today (July 18th)

Some big names reporting Today:

NFLX, IBM, YHOO, VMW, EMC...

https://www.earningswhispers.com/calendar

Monday, July 11, 2016

Thursday, July 7, 2016

Brexit has been erased

BREXIT was a big deal a week ago but it did little to move the market. The initial sell off seemed like this is what the market has been waiting for to crash. Take a look at the chart today and it seems like BREXIT never happened, but the problem is it did happen.

As for its impact on the markets, I do not know if it has any significant impact on the US economy or even the the British economy, maybe it does. Anyone trading or watching this market for the last 6-7 years would know that this is a bull market which means that every dip is a buying opportunity and that is what just happened in my opinion. There probably are a wast number of traders who started their trading careers during this period of the bull market and hence it is probably their one good strategy to buy any sell offs or dips.
As for NDX I think it has to overcome $4462 to continue the uptrend.


Monday, June 13, 2016

US Retail Sales (MoM) (May)

Tomorrow 12:30  Tues, JUN 14

The "retail control group", published by US Census Bureau, represents the total industry sales that are used to prepare the estimates of PCE for most goods.

Wed, JUN 15
18:00    US Fed Interest Rate Decision


Saturday, June 11, 2016

NDX breaks out of the consolidation pattern today

For the last two weeks the index has been in consolidation mode, moving in a range closing up one day and down next, it must have frustrated the traders who were either long or short not letting either side be a winner. But it is the pattern that most markets follow a sharp move up or down, followed by a period of consolidation before the next move up or down. Today we saw exactly that move down after finding support at that level several times but once it broke it fiercely moved down, now we might see a move towards the 50 DMA at 4420.


Friday, June 3, 2016

Tuesday, May 31, 2016

Tomorrow - ISM Manufacturing PMI (May)

The Institute for Supply Management (ISM) Manufacturing Index shows business conditions in the US manufacturing sector It is a significant indicator of the overall economic condition in US. A result above 50 is seen as positive (or bullish) for the USD, whereas a result below 50 is seen as negative (or bearish).

Tuesday, May 24, 2016

NDX breaks out of it's descending channel

It looks like a clear breakout to the upside and if there is follow through we could be ending the consolidation zone and moving into a new trend. Today's move was also happened to take us above the 50 DMA which is a bullish sign. SPY also move above its 50 DMA we will see what happens during this week as there is nervousness about the Fed's decision, as anticipated, next month to increase its key interest rate by 0.25%.


Thursday, May 19, 2016

NDX found support today

As NDX found support near the month's (May) lows today. If the market bounce back from here we could be back in the channel and stay there for a while, maybe for the rest of the summer. Yesterday, with Fed's minutes coming out, the market did not move significantly as everyone was expecting. So analysts believe that the Fed has already started tightening the rates in the shadows 'using shadow' rates since 2014, therefore its not in a hurry to do anything now.


Monday, May 16, 2016

NDX consolidating below its 50 DMA

Today was an up day for most of the indexes, but looking closely at NDX it is still under the 50 DMA inside its consolidation channel, will be interesting to see if it breaks that channel this week and start a new trend up/down.


Thursday, May 12, 2016

Retail Sales (MoM) (Apr) - Tomorrow May13

The retail Sales released by the US Census Bureau measures the total receipts of retail stores. Monthly percent changes reflect the rate of changes of such sales. Changes in Retail Sales are widely followed as an indicator of consumer spending. Generally speaking, a high reading is seen as positive (or bullish) for the USD, while a low reading is seen as negative (or bearish).


Thursday, May 5, 2016

Nonfarm Payrolls coming out tomorrow

The market has been trading close range until the news comes out..

Friday morning Nonfarm Payrolls -


May 06
12:30
200K 
Consensus
215K
Previous
Unemployment Rate (Apr):

May 06
12:30
5% 
Consensus
5%
Previou

Wednesday, May 4, 2016

TSLA Earnings today

Two notable companies that will likely impact the price movement, announcing earnings today after the close and tomorrow before open:

TSLA will announce earnings today after close. 5/4/16
BABA will announce earnings before open tomorrow 5/5/16

Wednesday, April 27, 2016

AMZN reports earnings after close tomorrow

Companies reporting Tuesday after close:

ABAX, ACHC, AEM, AIV, AJG, ALDR, ALGN, AMCC, AMGN, AMZN, ARII, ATEN, ATHN, ATR, ATRC, AZPN, BCOV, BGS, BIDU, BMRN, BOOM, BRKS, BVN, CATM, CENX, CHDN, CHE, CHMT, CLD, CLW, COHR, COLM, COWN, CPHD, CPT, CUBE, DDR, DGII, DLR, ECOL, EHTH, ELLI, EMN, EPAY, EPR, ESS, EXLS, EXPE, EYES, FET, FII, FLEX, FLS, FPO, GB, GILD, GIMO, GNW, GRPN, HELE, HIG, HT, HTH, HURN, HWAY, INVA, IPHI, ISBC, JNPR, KBR, KRG, LEG, LNKD, LOGM, LPLA, MATW, MMSI, MOBL, MOH, MSA, MSCC, N, NATI, NFG, NPTN, NR, NSIT, NSR, NUS, OFIX, OMCL, OUTR, P, PCCC, PDFS, PFG, PODD, PXLW, QLIK, RGA, RGC, ROVI, RRC, RSG, SCSS, SGEN, SHOR, SKYW, SMCI, SNMX, SPN, SPNC, SRCL, STRZA, SWKS, SYNA, TEP, TLGT, TMST, TNDM, TRMB, TXTR, VCRA, VDSI, VGR, VR, VRSN, WDC, YRCW

Tuesday, April 26, 2016

Is the SPY rally coming to an end?


looking at the chart below very similar..


Monday, April 25, 2016

AAPL Earnings tomorrow after close

Earnings after Tuesday’s close including AAPL, TWTR, CMG:

AAPL, AFL, AIZ, AKAM, ARAY, ARI, ASH, AXS, BEAT, BLDP, BRX, BWLD, BXMT, BXP, BYD, CHRW, CINF, CLMS, CMG, COF, CREE, CRUS, CUDA, CVA, EBAY, EEFT, EQR, EW, EXAC, FE, FOE, FSP, FTI, FTNT, HAWK, HIW, HLS, HUBG, IRBT, ISIL, JBSS, JBT, KLAC, MKTO, MRCY, MTSI, MWA, NANO, NCR, NUVA, O, PEI, PNRA, PSA, PSB, RHI, RMD, RNR, SKT, SLCA, T, TEX, TMK, TSS, TWTR, TX, ULTI, VNTV, WNC, WRB, X, ZIXI

Friday, April 22, 2016

GOOG Q1 miss..

Alphabet -5%  analysts lower price targets,  a Q1 miss driven by ad price declines, and nearly a dozen analysts have come in with price target declines.


Friday, April 15, 2016

Volatility at tradeable lows

VIX is at lows seen in late Oct.


Thursday, April 14, 2016

GOOGL reports earnings after the close next Thursday

Google parent Alphabet (GOOG, GOOGL) reports earnings after the close next Thursday...

Wednesday, April 13, 2016

A clear breakout after some consolidation

The market showed a clear breakout after consolidating for a few weeks. It broke above the previous highs of 207 gaping up in the direction of the recent trend. We would need to see a follow through in the next few days to see some new highs. We have to remember that this is the level from were the market tanked in late Dec early Jan. If the market overcomes the next resistance around 209 area this will be very bullish and we could see some new highs with the earning season still in progress I think that is a good possibility.


Monday, April 11, 2016

the market is in consolidation phase

SPY is consolidating the gains from the last month. Its movement is very similar to the area of consolidation around the end of Feb - beginning of March, we saw the market move side-ways for 5 days and then a breakout happened on the 6th day. If we see a move higher tomorrow we could be repeating those higher high's and maybe see all time highs. On the other hand if we see a breakout to the downside we could be in for a revisit of the lows we saw the 2nd week of Feb.


Sunday, April 10, 2016

Tomorrow could be a down day?!!

Not that it makes any sense but if we look at what has been happening in the market, an up day followed by a down day almost of the same magnitude.. tomorrow should be a down day??


Thursday, April 7, 2016

SPY 50 DMA on the weekly chart

SPY 50 DMA on the weekly chart is worth noticing... where the market stopped today!


Wednesday, April 6, 2016

Fed leaves rate unchanged

The Fed leave interest rates unchanged and the market likes it and we see a late rally after the minutes came out of the last months meeting.

FOMC stands for The Federal Open Market Committee that organizes 8 meetings in a year and reviews economic and financial conditions, determines the appropriate stance of monetary policy and assesses the risks to its long-run goals of price stability and sustainable economic growth. FOMC Minutes are released by the Board of Governors of the Federal Reserve and are a clear guide to the future US interest rate policy.

Monday, April 4, 2016

207 is offering some resistance

207 is also Dec 15 high, form where the market  plunged to the low of 181. It is the price where the market crash started and we saw the low of 181 twice and yet we are back at that level. The SPY did retreat from that level today. If we look closely the market did reach a high of 207.14 and the reversed from that point so it will be giving some hope to traders who are short but we will have to see if there is a follow through for the rest of the week. We are entering into the earnings season next week so it will all depends on the type of earnings announced.


Thursday, March 31, 2016

SPY breaches 52-Days high and gaps up

The 52-Day's high was breached and next the market gaped-up in the same direction, today we saw a minor reversal in the early hours of the session but found support near the 50 DMA. The market seems to be in bullish mode for now.


Monday, March 28, 2016

Consumer Confidence (Mar) Tomorrow


Consumer Confidence (Mar):


Mar 29
14:00
94.0 
Consensus
92.2
Previous

Wednesday, March 23, 2016

SPY 52-Day high

SPY 52-Day high has not been breached yet. This is important for the bull move to continue otherwise bear have the upper hand and we can see the market move down toward its 50 DMA and even lower below it.


Monday, March 21, 2016

SPY 50 Day MA turning upwards

I wonder if this scenario can occur, when the 50 DMA turns around and moves upwards the underlying move down meet somewhere in the middle. In that hypothetical scenario the 50 DMA can move to 200, SPY touches 206 and starts moving lower to the meet 50 DMA at 200 and then goes under it or maybe it will bounce off of it several times before going down under the 50 DMA, just a maybe...


Tuesday, March 15, 2016

Trade Federal Reserve interest rate decision

Wed, Mar 16 2016

Will the Federal Reserve hike its interest rate? Will the FOMC provide hints about the monetary policy...should not expect anything more than a statement about staying the course for gradually higher interest rates and monetary policy normalization.

Monday, March 14, 2016

Retail Sales (MoM) (Feb)

Tuesday  morning Economic Data:

Mar 15
12:30
- 
Consensus
0.2%
Previous
The retail Sales released by the US Census Bureau measures the total receipts of retail stores. Monthly percent changes reflect the rate of changes of such sales. Changes in Retail Sales are widely followed as an indicator of consumer spending. Generally speaking, a high reading is seen as positive (or bullish) for the USD, while a low reading is seen as negative (or bearish).


Thursday, March 10, 2016

SPY fluctuates 500 points today

Even though the SPY fluctuated 500 points, it closed not far from where the open. Looking at today's candle, it was similar to 2/2, a big move down and a consequent close up, little change. Today's move could be attributed to the ECB's interest rate's decision. It cut the interest rates to 0 which rocked the markets initially but soon normalized. I believe this could be the beginning of the next leg down. The strong ISM report (dispelling the worries of a recession) had pushed the markets higher up until now, but this act from the ECB could create confusion about the state of the European economy and the rest of the world.


Monday, March 7, 2016

SPY above 50 day SMA - Bullish territory

It was a complete inside day but the SPY has been trading above its 50 day SMA for the last two weeks or so as long as we stay above the 50 SMA we are in bullish territory


Thursday, March 3, 2016

SPY touching 200 after two months

200 on SPY can prove to be a strong resistance combine that with the employment report tomorrow and we can see a big drop from here.


Wednesday, March 2, 2016

Economic reports coming out Friday, MAR 04

Unemployment Rate (Feb)

Mar 04
13:30
4.9% 
Consensus
4.9%
Previous
Nonfarm Payrolls (Feb)

3


Mar 04
13:30
190K 
Consensus
151K
Previous

Tuesday, March 1, 2016

Explosion in Implied Volatility since Dec 15

The avg implied volatility is now 220 vs 50 (pre Dec 2015), that is quite a jump in IV and looks like is going to stay here. As long as IV is this high we can expect anything from this market just like what we saw today an overall movement of 500 points in the SPY.


Monday, February 29, 2016

VIX is creeping up again

VIX has turned around near the 19-20 zone and is creeping up again..


Wednesday, February 24, 2016

Tomorrow's important economic report

US Durable Goods Orders 

Feb 25
13:30
0.2% 
Consensus
-1.2%
Previous
The Durable Goods Orders measures, released by the US Census Bureau, the cost of orders received by manufacturers for durable goods, which means goods planned to last for three years or more, excluding the transport sector. As those durable products often involve large investments they are sensitive to the US economic situation. Generally speaking, a high reading is bullish for the USD, while a low reading is seen as Bearish.

Tuesday, February 23, 2016

Resistance above the 194 still strong

This is the 3rd time SPY retreated near the 194-195 zone. If this is nt a trap to lure-in all the bears and then move upwards, the downside would most likely be much more fast and furious. Key support right now is around 1910 - 1885. If that breaks then most likely things would unravel quite quickly to the downside and there would be a very high likelihood that the SPY will easily take out the recent low of 1810.


Monday, February 22, 2016

the 'Fed' was feeding the rally

Here is a former Dallas Fed President Richard Fisher appeared on CNBC in what may go down as one of the most candid interviews to date. Fisher explains that the intent of QE was to create a wealth effect whereby increased asset prices provided a catalyst to spend.

https://youtu.be/7nuzT3rchPU

Friday, February 19, 2016

Are we facing a 2008 like melt down in the markets?

Examining the chart below, it appears the market (SPY) is displaying a pattern similar to the year 2000 and 2008. First we can see a topping pattern, and we can also clearly see the candles getting longer, implying an increase in volatility as was evident on those other two occasions. If it turns out to be true I believe we could see the market drop to the 130 level on the SPY. When will the drop happen is not something either I or anyone else can predict.


Tuesday, February 16, 2016

SPY, where do we go from here?

If bulls can keep the upward momentum we can see 190 - 194 zone and then see another round of selling continue that will take us to new lows..


Friday, February 12, 2016

Trader's Tax deduction rules

Something I found on MSN, pertaining to trading and tax rules. (below is an excerpt from the article that is related to trading rules).

"Those who trade in securities have significant tax advantages compared with investors. The expenses of traders are fully deductible and are reported on Schedule C (investors report their expenses as a miscellaneous itemized deduction on Schedule A, subject to an offset of 2% of adjusted gross income), and traders’ profits are exempt from self-employment tax. Losses of traders who make a special section 475(f) election are fully deductible and are treated as ordinary losses that aren’t subject to the $3,000 cap on capital losses. And there are other tax benefits.
But to qualify as a trader, you must buy and sell securities frequently and look to make money on short-term swings in prices. And the trading activities must be continuous. This is different from an investor, who profits mainly on long-term appreciation and dividends. Investors hold their securities for longer periods and sell much less often than traders.
The IRS knows that many filers who report trading losses or expenses on Schedule C are actually investors. So it’s pulling returns and checking to see that the taxpayer meets all of the rules to qualify as a bona fide trader"

Here is the link to the msn article: http://www.msn.com/en-us/money/taxes/16-tax-audit-red-flags/ss-BBnip0E?ocid=mailsignout#image=14

Thursday, February 11, 2016

We should see a bounce from this level

As contrary to my earlier belief that we are moving down to the 170 level, today SPY touched the Jan 20th lows of 181.4 and bounced back from there. Now it will be interesting to see if this up move lasts for a few days and overcome the resistances at 187, 190, 194 and 200. I think we might see a move to the 187 level and then back down further to new lows but it is just my guess.


Monday, February 8, 2016

Should we see a final push lower now

SPY fell below a major support of 187 today. Sometime this week I think we could see a re-test of the Jan lows of 181 and below is a support zone near 174. With VIX at the elevated levels (currently @26) market volatility is going to be high and market moves will be erratic and large until volatility dies down.


Wednesday, February 3, 2016

Employment numbers coming out this FRIDAY, FEB 05

These two important reports coming out on Friday will move the markets one way or the other. This time these numbers are suppose to be watched more closely then in the previous months.

13:30 USD Nonfarm Payrolls (Jan)

13:30 USD Unemployment Rate (Jan)3

     (Consensus  5% Previous 5%)


Tuesday, February 2, 2016

The VIX Key

Different levels to watch for VIX. Something I found necessary to watch while I am trading.


Monday, February 1, 2016

US oil drillers to report billions in 2015 losses


American oil and gas producers are expected to announce 2015 losses totaling over $15 billion:

Hess Corporation reported a net loss of $3 billion
Murphy Oil Corporation lost $2.27 billion
Chevron lost $588 million

Sunday, January 31, 2016

SPY breakout on Friday

It looks like a clear breakout this last Friday... the last trading session of the month!


Tuesday, January 26, 2016

SPY 190 is acting as short-term resistance zone

After touching the 181 level the SPY seems to have a hard time moving above the 190 level, which reminds me of the 200 level back in Aug 15. In Aug after touching the 181 level SPY was rejected at the 200 level at least 3 times before falling to the 187 level and bouncing to the 210 level. Currently I feel that if we do not overcome the 190 level we could fall even below the 181 level (just a guess).


Sunday, January 24, 2016

Is the down trend over?

The market has declined considerably $15 trillion globally by some accounts but looking at the chart below there is something different. As we saw a steady decline inside a channel, that channel seems to be broken during the market session last week. We have to see if this move is long lasting and we see the market moving up to the 204-205 area or we see another big selloff form here?


Thursday, January 21, 2016

Oil prices and the market decline


Wonder why is the oil price declining and along with it the all the markets? It looks like as oil company profits are plummeting, so oil company shares are plummeting, and that is dragging down the whole market. Does the lifting of international sanctions against Iran send more oil flowing into markets that are already awash in crude and also because economic growth in China, the world's second-largest oil consumer after the U.S., is slowing.
Two of the biggest oil companies in the world, Exxon and Chevron, are part of the 30-member Dow Jones industrial average. Of the 20 biggest share price losers in the S&P 500 this year, 13 are energy companies.
But this latest plunge in prices to under $30 a barrel has investors worried that oil prices are falling because global growth is slowing, as businesses and consumers in many developing countries, particularly China, cut back on spending.